3 min read
Connext Observability Framework: A New Way to Monitor Distributed Systems
 Juhi Ranjan
:
June 28, 2023
Maximizing Performance and Reliability – Layer by Layer – in Your Distributed Systems
Have you ever wondered how well your distributed system is performing in real-time? Can you diagnose issues quickly when they arise? If not, don't worry – we have the solution for you! We recently introduced the RTI Connext® Observability Framework, designed specifically to provide deep insights using the Data Distribution Service (DDSTM) databus. So if you’re ready to take your observability game to the next level, let's dive in!
Observability is critical in today's increasingly distributed and complex software systems. To effectively observe these systems, all layers must be monitored dynamically, including application, middleware, network, and infrastructure layers. This approach involves adding instrumentation to all points of interest, integrating telemetry backends and visualizing the data of interest.
Why aren’t more companies doing it? For the simple reason that monitoring systems can be challenging. The complexity of today’s distributed systems and the limited availability of performance metrics for middleware often block the effort to gain insight across the entire system. Despite these challenges, effective observability is essential for quickly diagnosing and resolving issues, optimizing performance, and ensuring system reliability. Without it, developers and operators may waste time trying to diagnose the issue in the wrong place, leading to increased downtime and frustration.
What is the Connext Observability Framework?
The Connext Observability Framework is a powerful tool for gaining deep visibility into the current and past states of Connext applications, enabling developers to proactively identify and resolve potential system issues. The framework enables users to scalably collect telemetry data from individual Connext applications and distribute that data to third-party telemetry backends like Prometheus® and Grafana® Loki®. Whether you're debugging, monitoring CI/CD processes, or keeping an eye on deployed applications, the Observability Framework provides the data you need to ensure reliable and high-performance operation.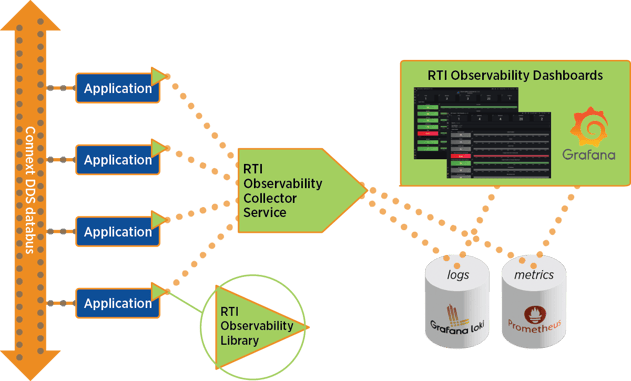
The three components that make up the Connext Observability Framework are the RTI Observability Library, the RTI Observability Collector Service, and the RTI Observability Dashboards. These components work together to enable telemetry data collection, storage and visualization for Connext applications.
RTI Observability Library allows you to collect and emit Connext metrics and logs, giving you deep visibility into the state of your Connext applications. Some key features of the RTI Observability Library include:
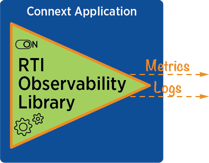
- Ability to enable and disable use at runtime using Quality of Service (QoS) policy
- Runtime changes to the set of emitted telemetry data
- Low overhead, ensuring minimal impact on the performance of the monitored components
- Collection of more than 80 metrics that provide insights into critical aspects of the Connext databus, such as saturation, traffic, data loss and statuses
RTI Observability Collector Service works in tandem with the Observability Library to collect telemetry data. It is distributed as a Docker image, and can work in two modes: Forwarder and Storage. In the current release (7.1.0) the storage mode is available, which is where the Collector Service stores telemetry data in third-party observability backends, such as Prometheus for metrics and Grafana Loki for logs. In this release, Observability Collector Service includes native integration with Prometheus and Grafana Loki to store metrics and logs, respectively. Key features of the Observability Collector Service include:
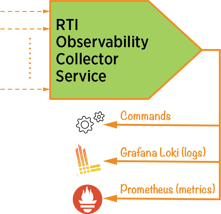
- Collection of telemetry data emitted by Connext applications or other collectors
- Storage of telemetry data in third-party components
- Command forwarding from Observability Dashboards to Connext applications
RTI Observability Dashboards provide a powerful set of hierarchical Grafana dashboards for monitoring and analyzing telemetry data collected by the Observability Collector Service. The dashboards are designed to provide real-time alerts when issues arise and to help quickly identify the root cause of any problems. Important features of the Observability Dashboards include:
- Receiving telemetry data from the Observability Collector Service and third-party backend tools
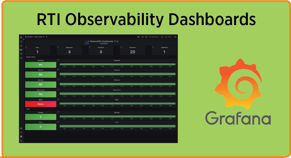
- Hierarchical dashboard architecture to provide a comprehensive view of the system health status
- Real-time alerts to proactively identify and address any issues
- Visualization of key metrics to aid in root cause analysis
What are the Benefits of Using Connext Observability Framework?
By seamlessly integrating the Observability Framework with popular third-party tools such as Prometheus, Grafana, and ELK, users gain the capability to monitor both Connext and non-Connext technologies using a unified set of Observability tools. This integration allows users to consolidate and streamline monitoring efforts.
The telemetry data pipeline within the Observability Framework is designed to scale effortlessly as your deployments expand from local to global environments. This ensures that regardless of the size of the system, users can effectively monitor its health and performance.
Furthermore, the Observability Framework provides the ability to visualize real-time and historical data swiftly. This visualization capability enables users to troubleshoot issues more efficiently, thanks to the ability to analyze and interpret data trends and patterns to identify and address potential problems.
Getting started with Connext Observability Framework
The Getting Started Guide for the RTI Connext Observability Framework provides valuable information on how to utilize the framework effectively. It emphasizes the separate installation process for the Observability Framework, which requires downloading and installing both the Observability Library and the Collection, Storage and Visualization components.
The guide walks users through the installation steps, including options for hosting the components on a Linux host within the same LAN as your applications or on a remote Linux host accessible over the WAN using RTI Real-Time WAN Transport.
An example C++ program is provided in the guide, which simulates temperature sensor data. It demonstrates how to use the Observability Library to distribute telemetry data (logs and metrics) to the Observability Collector Service. The collector then stores this data in Prometheus for metrics and Grafana Loki for logs, enabling analysis and visualization using Grafana.
You can find our Getting Started guide and other resources here. Also, a new capability brief for the Connext Observability Framework is now available for download.
About the author
 Juhi Ranjan is the Group Product Manager at RTI, responsible for aligning market needs with RTI's flagship products. She is responsible for all aspects of the product strategy for Connext Professional, from conception to launch. Additionally, she oversees a team of product managers at RTI who are responsible for driving product initiatives.
Posts by Tag
- Developers/Engineer (177)
- Connext DDS Suite (77)
- Technology (74)
- News & Events (73)
- 2020 (54)
- Standards & Consortia (51)
- Aerospace & Defense (48)
- Automotive (35)
- 2023 (34)
- 2022 (29)
- IIoT (27)
- Leadership (24)
- 2024 (22)
- Cybersecurity (20)
- Healthcare (20)
- 2021 (19)
- Connectivity Technology (16)
- Military Avionics (15)
- Culture & Careers (14)
- FACE (13)
- Connext DDS Pro (10)
- JADC2 (10)
- ROS 2 (10)
- 2025 (8)
- Connext DDS Tools (7)
- Connext DDS Micro (6)
- Databus (6)
- Transportation (5)
- Case + Code (4)
- Connext DDS (4)
- Connext DDS Cert (4)
- Energy Systems (4)
- FACE Technical Standard (4)
- Oil & Gas (3)
- RTI Labs (3)
- Research (3)
- Robotics (3)
- #A&D (2)
- Connext Conference (2)
- Edge Computing (2)
- MDO (2)
- MS&T (2)
- TSN (2)
- ABMS (1)
- C4ISR (1)
- ISO 26262 (1)
- L3Harris (1)
- LabView (1)
- MathWorks (1)
- National Instruments (1)
- Simulation (1)
- Tech Talks (1)
- UAM (1)
- Videos (1)
- eVTOL (1)
 Success-Plan Services